Beyond the GA4 Maze: How ScottFish.com Makes Analytics Accessible Again
March 3, 2025

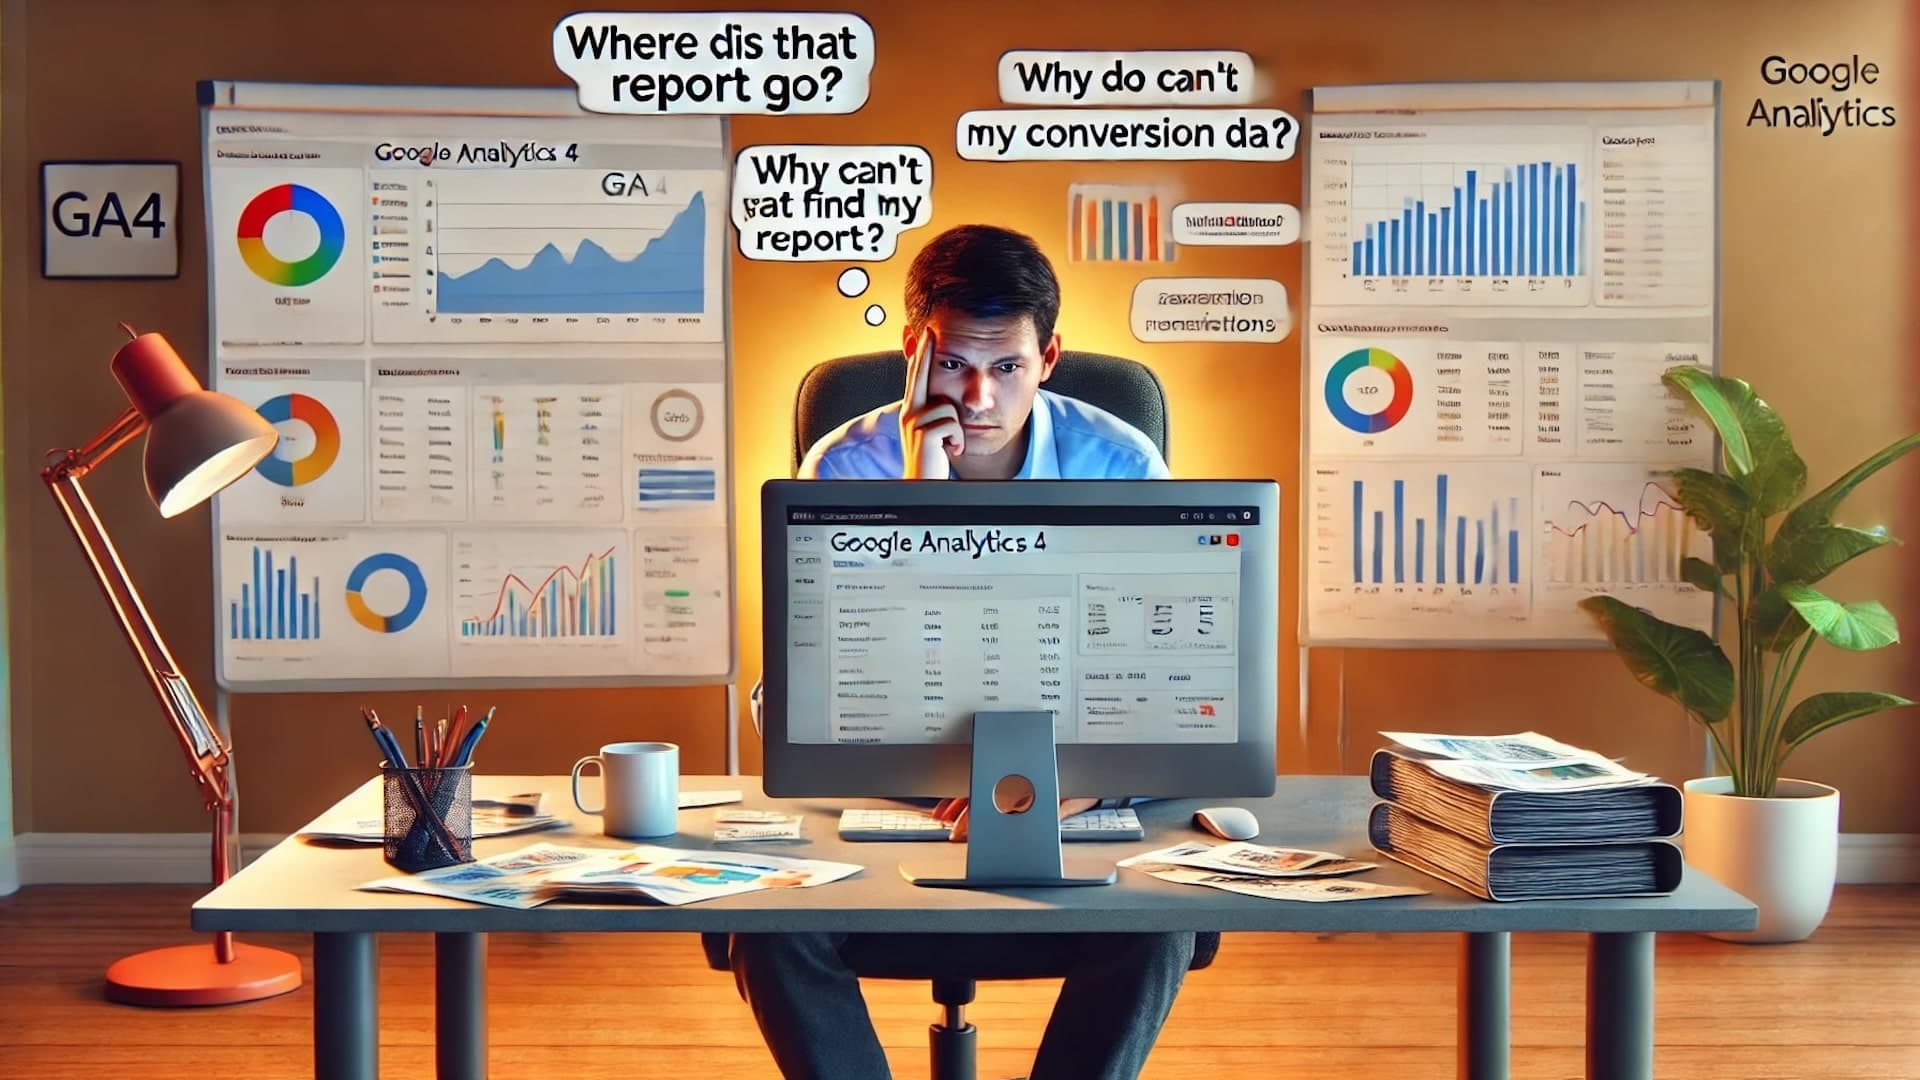
“Where did that report go?” “Why can't I find my conversion data?” “I just spent two hours trying to recreate a simple dashboard...”
Sound familiar? You're not alone.
While Google Analytics 4 delivers powerful capabilities, it's also created the greatest treasure hunt in digital marketing history – and not the fun kind.
The GA4 Learning Cliff
Let's be honest: GA4 wasn't designed with user experience as the priority.
What was once intuitive in Universal Analytics has become a labyrinth of hidden menus, confusing terminology, and disappearing features.
Our research shows the average marketer spends 5.4 hours per week just navigating GA4's interface – that's over 280 hours per year of pure frustration. Time that could be spent on strategy, optimization, or frankly, anything more valuable.
The Real Cost of Poor Analytics UX
- Wasted time:Hours spent finding basic metrics
- Missed insights:Critical data patterns overlooked
- Team resistance:“I'll just use the old system a bit longer...”
- Decision delays:When data is hard to access, decisions get postponed
Why GA4's Interface Misses the Mark
The problem isn't GA4's capabilities – it's the disconnect between how marketers think and how the platform organizes information:
- Scattered metrics across different reports
- Critical data hidden behind complex exploration tools
- Non-intuitive naming conventions
- Endless clicks to reach actionable insights
- Interface that prioritizes flexibility over usability
One marketing director we spoke with put it bluntly: “GA4 feels like it was designed by engineers for engineers, not for the people who actually need to use it daily.”
How ScottFish.com Solves the GA4 UX Problem
We built ScottFish.com with a simple mission: give marketers back their time and sanity. Our platform doesn't replace GA4 – it transforms how you interact with it.
Our Approach:
- Intuitive Organization:Data arranged how marketers actually think and work
- One-Click Access:Critical metrics surfaced immediately, not buried under menus
- Visual Clarity:Clean interface that highlights trends and anomalies
- Customizable Views:Tailor your dashboard to what matters to your business
- Time-Saving Templates:Pre-built reports for common marketing needs
Real Results: From Frustration to Flow
When digital agency Bright Spark started using ScottFish.com, the impact was immediate:
“We went from spending 6+ hours weekly wrestling with GA4 to having our key metrics available in seconds. Our team's analytics adoption increased by 80%, and we're making faster, more confident decisions. What used to be a dreaded task is now seamless.”— Sarah Chen, Analytics Director at Bright Spark
The numbers tell the story:
See the Difference: GA4 vs. ScottFish.com
- Navigate to Reports
- Click Engagement
- Find Conversions
- Select time period
- Add comparisons manually
- Add segments for meaningful insights
- Export to spreadsheet for team sharing
- Repeat next time you need the data
Time spent: ~4-8 minutes
- Log in
- See conversion data on your dashboard
- Click to drill down if needed
Time spent: ~10 seconds
Getting Started is Simple
Ready to make GA4 work for you instead of against you? ScottFish.com connects to your Google Analytics in minutes:
- 1Create your account
- 2Connect your GA4 property
- 3Choose from our template dashboards or customize your own
- 4Start saving time immediately
Free Trial Available
Experience the difference with our free trial. No credit card required.
Conclusion: Analytics Should Empower, Not Impede
GA4's power shouldn't come at the cost of usability. At ScottFish.com, we believe analytics should accelerate your marketing, not slow it down.
Our platform puts you back in control – making data accessible, insights immediate, and decision-making confident.
Ready to transform your analytics experience? Your GA4 data is waiting to be unleashed.